The extension provides a new tab in Sellerdeck that shows you details of all your sales in a time period that you choose.
As well as a graphical display of total sales, the extension displays commonly-used metrics such as the average order value and average basket size, enabling you to see at a glance your overall sales performance for the selected period.
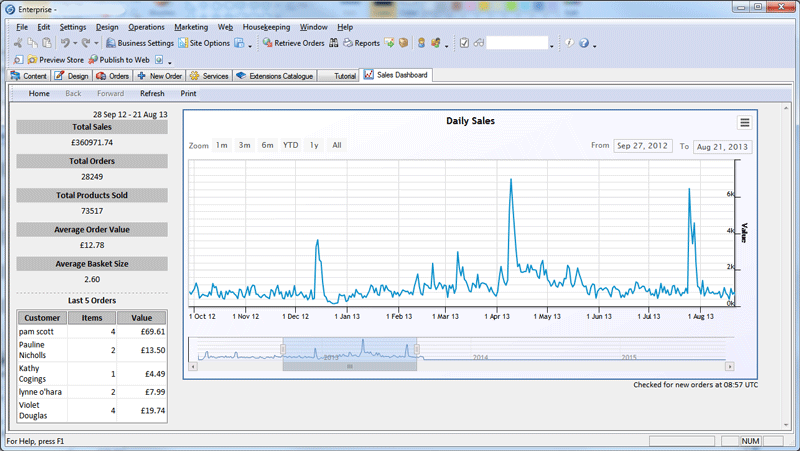
When the tab first loads, it reads all your orders and displays them in a graph for the last month (the initial default setting). A summary of your order total is also displayed, and the details of the last five orders are shown at the bottom left.
Whenever you select a different scale on the graph, either from one of the preset buttons, or by selecting an area using the mouse, or by the sliders at the bottom of the graph, then the graph is redrawn and the totals are recalculated for the new period.
The Sales Dashboard regularly checks to see if any new orders have been downloaded since the chart was last drawn and if any are found the details are added to the graph. The totals and last five orders are also updated automatically.
Included in Cover or Desktop 365
For discussion and news about this extension, access the Sellerdeck Community.
Extension by: Tod Designs
Version: 1.0.1
Minimum requirements: Sellerdeck Desktop 2016 (v16.0.1)